The arrival of artificial intelligence (AI) and automated robots is already a fact. But as we enter the era of automation, for many people the main concern is whether this change will cause them to lose their job. When choosing a career it is important to think about what the future is predicted to look like for that field, and in this regard, as we start to see more robots taking over jobs, it will become increasingly important to choose a career. that has a low risk of being automated in the future. And if that career path is projected to grow over the next decade, so much the better. In short: He who does not adapt, stays on the road. Healthy competition within a labor area or field that used to occur between workers now pits people against robots and artificial intelligence systems.
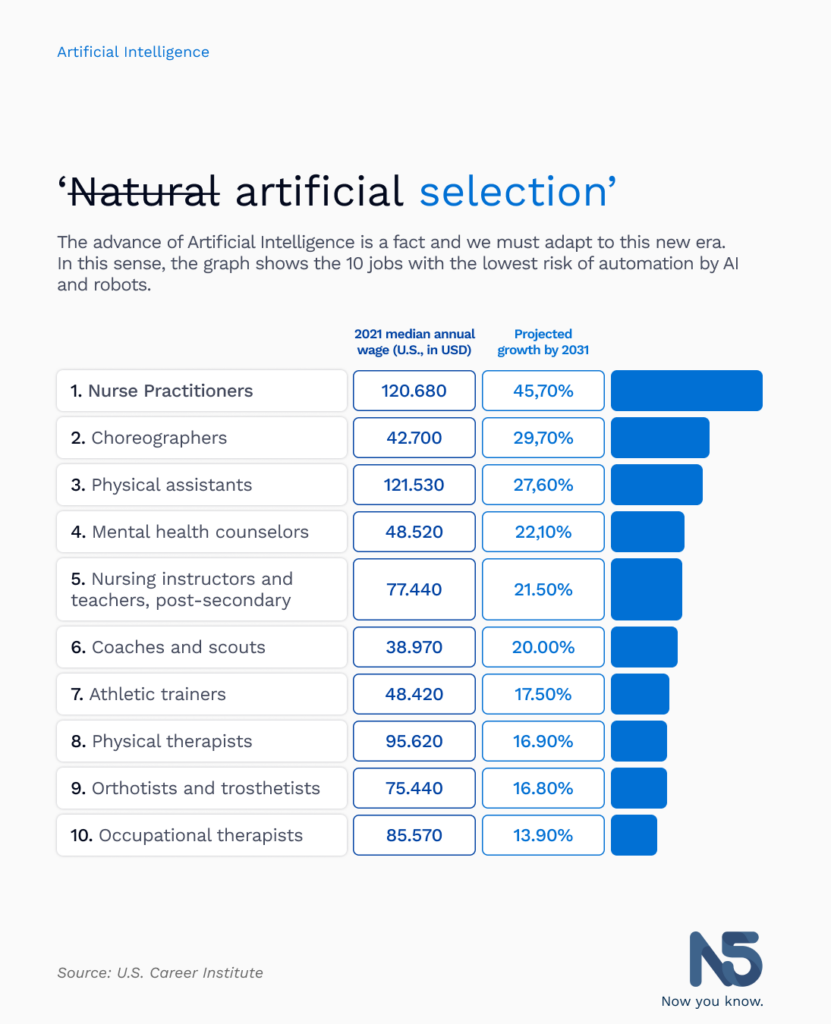
So, which jobs are more protected from the threat implied by the use of AI and robots? Using results generated with automation risk data, a graph of the 65 jobs with the lowest risk of robotic automation was created. The following 65 occupations were determined to have a 0.0% job automation risk probability based on the skills, knowledge, skills, and activities required to perform the job well. With the same low risk of automation, they are ranked in order of projected growth to 2031, to determine which occupations will continue to thrive in the age of AI and robotics:
Profession / US Median Annual Salary in 2021 (in USD) / Projected Growth to 2031
- Practitioner Nurses / 120,680 / 45.7%
- Choreographers / 42,700 / 29.7%
- Medical assistant / 121,530 / 27.6%
- Mental Health Counselors / 48,520 / 22.1%
- Post-Secondary Nursing Instructors and Teachers / 77,440 / 21.5%
- Coaches and Scouts / 38,970 / 20.0%
- Athletic trainers / 48,420 / 17.5%
- Physiotherapists / 95,620 / 16.9%
- Orthopedists and prosthetists/ 75,440 / 16.8%
- Occupational Therapists / 85,570 / 13.9%
- Marriage and Family Therapists / 49,880 / 13.9%
- Art therapists / 59,500 / 11.2%
- Music therapists / 59,500 / 11.2%
- Social Health Workers / 60,840 / 11.1%
- Mental Health and Substance Abuse Social Workers / 49,130 / 11.1%
- Bioengineers and Biomedical Engineers / 97,410 / 9.8%
- Post-Secondary Psychology Teachers / 77,860 / 9.6%
- Fitness and Wellness Coordinators / 60,360 / 9.5%
- Soil and Plant Scientists / 66,750 / 9.1%
- Education administrators, from Kindergarten to Secondary / 98,420 / 4.9%
- Oral and Maxillofacial Surgeons / 311,460 / 4.6%
- Firefighters / 50,700 / 4.3%
- First Line Supervisors of Fire Prevention and Extinction Workers / 78,230 / 4.1%
- Urban and Regional Planners / 78,500 / 3.8% Recreational Therapists / 47,940 / 3.6%
- Direct, Religious Activities and Education / 46,980 / 3.6%
- Dermatologists / 302,740 / 3.1%
- Neurologists /267,660 / 3.0%
- First Line Supervisors of Police and Detectives / 99,330 / 2.8%
- Neuropsychologists / 102,900 / 2.8%
- Clinical Neuropsychologists / 102,900 / 2.8%
- Orthopedic Surgeons, Except Pediatric / 306,220 / 2.7%
- Architects, Except Landscape and Naval Architects / 80,180 / 2.7%
- Surgeons, All others / 297,800 / 2.6%
- Emergency Management Directors / 76,730 / 2.5%
- Preventive Medicine Physicians / 183,655 / 2.4%
- Physical Medicine and Rehabilitation Physicians / 231,500 / 2.4%
- Hospitalists / 247,741 / 2.4%
- Administradores de Educación, desde Kindergarten hasta Secundaria / 98.420 / 4,9%
- Sports Medicine Doctors / 249,738 / 2.4%
- Pediatric Surgeons / 290,310 / 2.2%
- Obstetricians and Gynecologists / 296,210 / 1.7%
- Interior designers / 60,340 / 0.9% Landscape designers / 67,950 / -0.1%
- Hunting and Fishing Wardens / 60,730 / -3.5%
- CEOs / 179,520 / -7.3%

